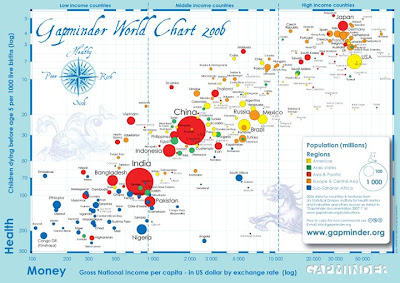
IN YOUR FACE!
Hans Rosling a genius extraordinnaire has created a program called Gapminder which compiles all the numbers from governmental and intergovernmental databases and then charts them in interactive charts! You can choose your x and y-axis (Eg. Per Capita Income (PPP) vs. Use of Contraceptives) thereby determining what you are indeed making statistically significant. Furthermore once your chart is produced the countries are plotted as colourful dots whose size is relative to the population...so China's dot is huge! So is India's! Lastly you can can see progress through time because this program gives you data all the way back from the 1950s...so you can choose a movie-like option which when viewed is comparable to watching an Aussie-rules footie game (read: tres exciting).
 Cool, eh? Thought so.

4 comments:
you've just given me a reason to NOT do my work.
hahaha! when i found it i was researching for a paper and that was not good...i think i spent an hour and a bit fiddling around on it, for the sake of research of course!
Was that before or after you then printed them out and posted them around your room??
hey now...no need for the dissemination of unnecessary information!
Post a Comment